
Ukraine’s Wartime Industries — The Weight of Agriculture, Manufacturing, Services, and Energy
This article shows the weight of Ukraine's industries in the order of agriculture, manufacturing, services, and energy. The sector-by-sector breakdown is only available through 2024. The scope covered by the statistics has changed partway through, some indicators have stopped being published, and others have switched to estimates. Drawing on data published by the State Statistics Service of Ukraine and the National Bank of Ukraine, we attach the scope, point in time, and basis to each figure.


There are plenty of Japanese-language overviews that line up Ukraine’s industries as “agriculture, manufacturing, IT.” But four and a half years after Russia’s full-scale invasion of Ukraine on February 24, 2022, that kind of list can no longer be read as a picture of the present. The scope covered by the statistics has changed partway through, some indicators have stopped being published, and in some cases two different figures appear for the same item in the same year. This article presents the figures for each sector together with what, exactly, each figure counts. All figures are drawn from files that the relevant agencies had published as of September 23, 2026.
Which Ukraine Do These Numbers Cover?
A file published by the State Statistics Service of Ukraine (Derzhstat), “Gross Domestic Product by the Production Method and Gross Value Added by Type of Economic Activity” (2010–2024), carries a note at the end of the table. Figures for 2010–2021 exclude the temporarily occupied Autonomous Republic of Crimea and the city of Sevastopol; figures for 2014–2021 also exclude part of the temporarily occupied territory of Donetsk and Luhansk oblasts. For 2022–2024, the note reads: “excluding territory temporarily occupied by the Russian Federation, and part of the territory where hostilities are (or were) taking place.”
The part that shouldn’t be skipped over is the last clause. From 2022 onward, not only occupied territory but part of the combat zone is excluded from the count. The National Bank of Ukraine’s (NBU) external trade statistics carry a similarly worded note. The “structure of Ukraine’s industries” that appears below is the structure of what remains once that territory is excluded. Factories and mines located there are not recorded as having lower output — they disappear from the population being measured.
The Sector Breakdown Is Only Known Through 2024
From the same file, we calculated each sector’s share of gross value added at basic prices. Because these are nominal values at current prices, price movements as well as output volumes shift the shares. As of September 23, 2026, the most recent year for which a breakdown by economic activity is available is 2024.
| Economic activity (NACE category) | 2021 | 2024 |
|---|---|---|
| Public administration and compulsory social security (O) | 7.2% | 23.3% |
| Wholesale and retail trade; repair of motor vehicles etc. (G) | 15.8% | 13.8% |
| Manufacturing (C) | 12.0% | 9.7% |
| Agriculture, forestry and fishing (A) | 12.7% | 8.4% |
| Real estate activities (L) | 6.7% | 6.1% |
| Electricity, gas, steam and air conditioning supply (D) | 3.9% | 5.4% |
| Transportation, storage and postal activities (H) | 6.3% | 5.3% |
| Information and communication (J) | 5.5% | 4.7% |
| Mining and quarrying (B) | 7.5% | 4.6% |
The item that moved the most was one that doesn’t usually appear on lists of industries. “Public administration and compulsory social security” rose from 7.2% to 23.3% — more than tripling to become the single largest category. If one number were chosen to show how Ukraine’s economy has changed, it would be this one, not agriculture, steel, or IT. However, the published table does not show how activity related to national defense is classified within this category, and we have not confirmed the agency’s classification methodology, so this article states no more than that the share “increased.”
Agriculture — Before “Breadbasket of the World,” Say Which Number
On the 2025 harvest, an announcement from the Ministry of Economy, Environment and Agriculture posted on the Cabinet of Ministers of Ukraine’s website on December 26, 2025 states that 57.6 million tons of grain and 17.3 million tons of oilseeds were harvested, and that once the corn harvest is complete, the grain total is expected to reach about 60 million tons. This is a ministry announcement, not a confirmed figure from the State Statistics Service. The State Statistics Service’s annual file on sown area, gross harvest, and crop yield runs only through the confirmed 2022 figures, and its statistical bulletins on harvest progress stop at 2021.
Its share of exports has risen. In the National Bank’s balance-of-payments-based (BPM6) breakdown of goods exports by commodity, the share of “food and raw materials for food” rose from 43.7% in 2021 to 59.3% in 2025. The dollar amount, however, fell — from USD 27.687 billion to USD 22.532 billion. The share rose because other exports fell by even more. Over the same period, agriculture, forestry and fishing’s share of gross value added fell from 12.7% to 8.4%. That is not a contradiction; the denominators are simply different. The phrase “breadbasket of the world” explains neither of these two things.
The quantity harvested and the quantity that can be shipped out are also separate matters. An analysis published on July 28, 2026 by Poland’s Centre for Eastern Studies (OSW) states that in 2025, more than 85% of Ukraine’s food exports by volume moved by sea — reaching 95% for grain — and reports that on July 22, 2026, not a single merchant vessel entered a Black Sea port, after insurers had reportedly stopped underwriting new coverage. Ukrinform likewise reported on July 24 of the same year, citing an official’s account, that there had been about 30 attacks on ports in the preceding weeks. Neither of these is a primary source, and the shipping situation since then has not been confirmed.
Manufacturing — Did Output Fall, or Did the Count Shrink?
Steel is a sector where both are happening. According to figures compiled by the World Steel Association (worldsteel), Ukraine’s crude steel output was 21.4 million tons in 2021 (14th in the world) and 7.4 million tons in 2025 (23rd in the world, down 2.2% year on year). In exports too, on the National Bank’s BPM6 basis, “ferrous and non-ferrous metals and articles thereof” fell from USD 15.719 billion in 2021 to USD 4.715 billion in 2025, with its share of total exports falling from 24.8% to 12.4%. In gross value added, mining and quarrying’s share fell from 7.5% to 4.6%.
This is where the note mentioned at the outset matters. Facilities located in occupied territory are not recorded in the statistics as idle factories — they are not counted at all. How much of the decline reflects halted or reduced operations, and how much reflects the shrinking scope of what is counted, cannot be separated from the published totals alone. A sentence like “steel production has fallen to a third of what it was” collapses two separate things into one.
Services — IT Figures Mean Different Things Depending on Who Publishes Them
In the external trade statistics (BPM6, USD million) the National Bank updated on September 18, 2026, exports of “computer services” were 6,943 in 2021, 7,329 in 2022, 6,727 in 2023, 6,446 in 2024, and 6,655 in 2025. The line just above it in the same table, “telecommunications, computer and information services,” stood at 6,810 in 2025. In the State Statistics Service’s gross value added figures, “information and communication” (NACE J) came to UAH 309.677 billion in 2024. All three are called “Ukraine’s IT” in Japanese-language coverage, but they measure different things, in order: the value of cross-border computer-service exports; that same figure plus telecommunications and information services; and domestically generated value added (which includes telecommunications, broadcasting, and publishing).
Figures for the same year can also change later. At the start of the same file, the National Bank notes that it revised its 2022–2024 services trade data to reflect updated information from the State Statistics Service, based on Law No. 4505 of July 3, 2025, which restored the obligation to report statistics to state statistical bodies under martial law. The 2025 computer-services export figure of USD 6,655 million works out to 41.8% of total services exports (USD 15,904 million) and 12.3% of combined goods-and-services exports (USD 53,911 million) — both shares calculated by this article.
Transport moved in the opposite direction. Within services exports, transport fell from USD 4,760 million in 2021 to USD 2,519 million in 2025. The steepest drop was in pipeline transport, from USD 1,664 million to USD 244 million. Sea transport went from 616 to 383. Lumping logistics together under “services” hides this difference.
Energy — How to Read a Number That Looks Like It Grew
The share of “electricity, gas, steam and air conditioning supply” in gross value added rose from 3.9% in 2021 to 5.4% in 2024. But because these are nominal values at current prices, the share rises if tariffs or fuel prices rise, even if the volume supplied stays the same. Reading a rising share for a sector under attack as straightforward “growth” would be a mistake.
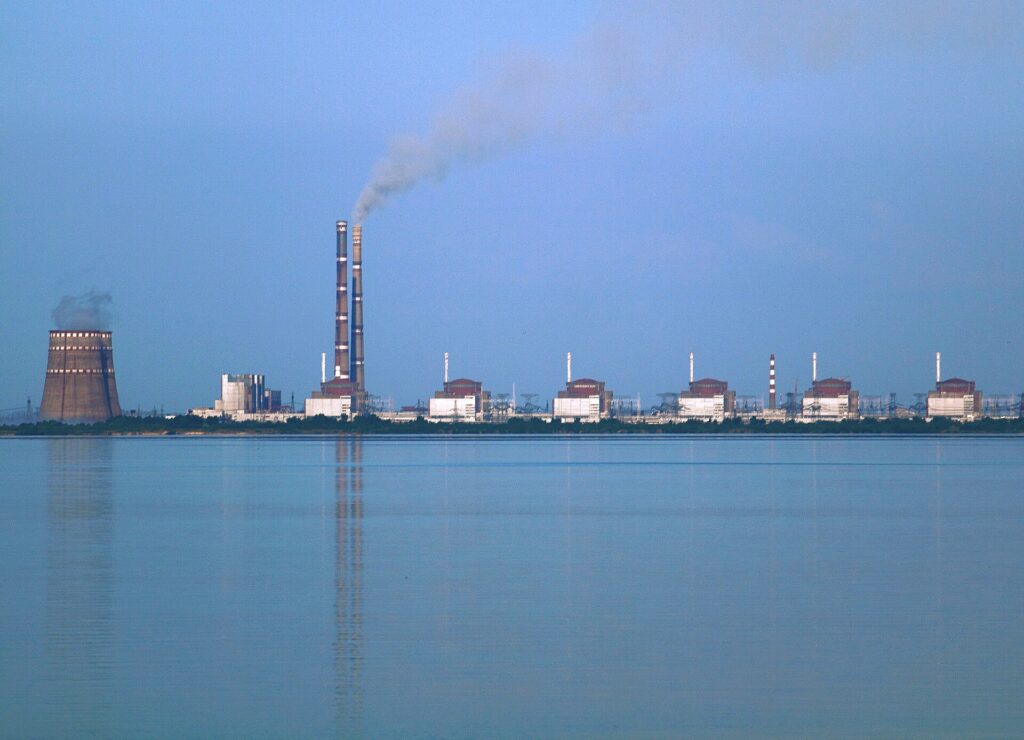
On its own Ukraine-related page, the IAEA (International Atomic Energy Agency) states that the Chornobyl Nuclear Power Plant site was under Russian military control from February 24 to March 31, 2022, and that the Zaporizhzhia Nuclear Power Plant has been under Russian military control since March 4, 2022, and remains under the control of the Russian Federation today. The agency keeps staff stationed at all five of Ukraine’s nuclear power plant sites. The generation mix itself, however, has not been confirmed against a public primary source. The State Statistics Service’s published energy balance file runs only through 2020.

Indicators That Stopped Being Published, and Indicators That Switched
Trying to write a full picture of Ukraine’s industries, employment is missing. The State Statistics Service’s annual Labour Force Survey file on “number of employed persons by economic activity” covers 2000–2021, and the last bulletin from that survey was published on November 17, 2022. The enterprise-survey-based “average number of employees by economic activity” also stops at 2017–2021. Employment by sector from 2022 onward cannot be shown from that agency’s published data.
Trade data has also switched partway through. On the agency’s front page, GDP is given through the second quarter of 2026 and the consumer price index through August 2026, yet goods imports and exports remain stuck at the cumulative figure for January–September 2025. The annual file on trade structure by commodity runs only through 2023. The National Bank writes that, for goods trade in the fourth quarter of 2025, it relies on State Customs Service data “because official data from the State Statistics Service is not available,” and states outright for another table that it has not updated it “because the State Statistics Service’s database on external trade is unavailable.” Even under the same label of “official statistics,” the way the numbers are produced changes partway through the year.
When the basis differs, two figures appear for the same item in the same year. Goods exports for 2021 were USD 68.07233 billion according to the State Statistics Service’s trade-structure-by-commodity data, and USD 63.621 billion according to the National Bank’s balance of payments. The National Bank publishes a reconciliation table showing that the difference consists of adjustments to FOB pricing, informal trade, processed goods, humanitarian aid, postal items, and similar items. Neither figure is wrong — the two simply use different standards.
A List Can Be Made: It Needs the Right Caveats
Lining up Ukraine’s industries by sector is still possible today. But every figure in this article covered a range that excludes occupied territory and part of the combat zone, for a different year, on a different basis. Scope, point in time, unit and currency, nominal or real, estimate or confirmed, and the publishing body: an item you cannot attach these six things to is safer left off the list.
This article was not written to present any particular sector or region as promising. The sector-by-sector figures show how the composition of output and exports has changed; they are not a list of business opportunities.
Sources and references
- Валовий внутрішній продукт виробничим методом та валова додана вартість за видами економічної діяльності (2010–2024, seven tables in current prices, prior-year prices, and constant 2021 prices. Table 1's note specifies the territorial exclusions for 2010–2021 / 2014–2021 / 2022–2024)
Published by State Statistics Service of Ukraine (Derzhstat) · Checked: 2026-09-23 - Annual national accounts (Dataset list. The by-economic-activity breakdown file was posted in December 2025)
Published by State Statistics Service of Ukraine · Checked: 2026-09-23 - Main page Derzhstat (Key indicators. GDP for Q2 2026 = UAH 2,305,664.0 million, up 100.4% year on year; consumer price index through August 2026; average wage for July 2026 = UAH 32,243.0; goods exports and imports frozen at the cumulative figure for January–September 2025)
Published by State Statistics Service of Ukraine · Checked: 2026-09-23 - Товарна структура зовнішньої торгівлі України (Trade structure by commodity. Total goods exports: USD 68,072,328.8 thousand in 2021, USD 37,584,289.0 thousand in 2023. The annual file runs only through 2023. Carries a territorial-exclusion note)
Published by State Statistics Service of Ukraine · Checked: 2026-09-23 - Щомісячні обсяги товарної структури зовнішньої торгівлі (Monthly trade structure by commodity. Coverage runs only through 2023)
Published by State Statistics Service of Ukraine · Checked: 2026-09-23 - Labour force survey (annual) (Dataset. ‘Number of employed persons by economic activity’ covers 2000–2021; the last bulletin was posted on November 17, 2022)
Published by State Statistics Service of Ukraine · Checked: 2026-09-23 - Survey of enterprises on labor statistics (Dataset. ‘Average number of employees by economic activity (quarterly)’ covers 2017–2021)
Published by State Statistics Service of Ukraine · Checked: 2026-09-23 - Areas, gross harvests and crop yield (annual) (Annual sown area, gross harvest, and yield. The confirmed-figures file runs through 2022; the harvest-progress statistical bulletin ovuzp_sg.zip runs through 2021)
Published by State Statistics Service of Ukraine · Checked: 2026-09-23 - Energy balance (Dataset. The annual energy balance file runs through 2020; related series cover 2007–2021)
Published by State Statistics Service of Ukraine · Checked: 2026-09-23 - External Trade in Goods and Services (Trade_y_en.xlsx, last updated September 18, 2026. Table 1.1 breakdown of goods exports by commodity, Table 2.1 services exports by type, Table 3.2 reconciliation between State Statistics Service data and the balance of payments, and the three notes at the top)
Published by National Bank of Ukraine (NBU) · Checked: 2026-09-23 - External sector statistics (The page hosting the file above)
Published by National Bank of Ukraine · Checked: 2026-09-23 - December 2025 crude steel production and 2025 global crude steel production totals (Table 3. Ukraine: 7.4 million tons in 2025, 7.6 million tons in 2024, down 2.2% year on year, 23rd in the world. World total: 1,849.4 million tons)
Published by World Steel Association (worldsteel) · Checked: 2026-09-23 - December 2021 crude steel production and 2021 global totals (Ukraine: 21.4 million tons in 2021, 20.6 million tons in 2020, 14th in the world)
Published by World Steel Association (worldsteel) · Checked: 2026-09-23 - Агровиробництво України у 2025 році: результати сезону та порівняння з ЄС (Posted December 26, 2025. 57.6 million tons of grain, 17.3 million tons of oilseeds; grain expected to reach about 60 million tons once the corn harvest is complete)
Published by Cabinet of Ministers of Ukraine (announcement by the Ministry of Economy, Environment and Agriculture) · Checked: 2026-09-23 - Ukraine: suspension of shipping to Black Sea ports and the associated risks (July 28, 2026. More than 85% of 2025 food exports and 95% of grain moved by sea; zero merchant-vessel port calls on July 22, 2026; insurers stopped underwriting; 2025 volumes of 73.3 million tons at Black Sea ports and 8.9 million tons at Danube ports)
Published by OSW (Centre for Eastern Studies, Poland) · Checked: 2026-09-23 - Ворог атакує порти: як не втратити агроекспорт (July 24, 2026. About 30 attacks on ports in the preceding weeks; more than 1,000 port-infrastructure facilities and more than 220 vessels damaged over the whole period; July exports down about 30% from June)
Published by Ukrinform · Checked: 2026-09-23 - Українським морським коридором перевезено 120 млн тонн вантажів (May 12, 2025. 120 million tons cumulative through the maritime corridor, of which 76 million tons was agricultural produce, shipped to 53 countries)
Published by Ministry for Reconstruction of Ukraine (now redirects to the Ministry of Infrastructure's site) · Checked: 2026-09-23 - Nuclear Safety, Security and Safeguards in Ukraine (The Chornobyl NPP site was under Russian Federation control from February 24 to March 31, 2022; the Zaporizhzhia NPP has been under Russian Federation control since March 4, 2022, and remains so. IAEA staff are stationed at all five nuclear power plant sites)
Published by IAEA (International Atomic Energy Agency) · Checked: 2026-09-23
Corrections and updates
- Changed the title (previous title: "Reading Ukraine's Industries Through Wartime Statistics — An Overview of Agriculture, Manufacturing, and Services")
If you find an error in this article, please tell us via Corrections. Once we have checked it, we will record in the article what was corrected and why.